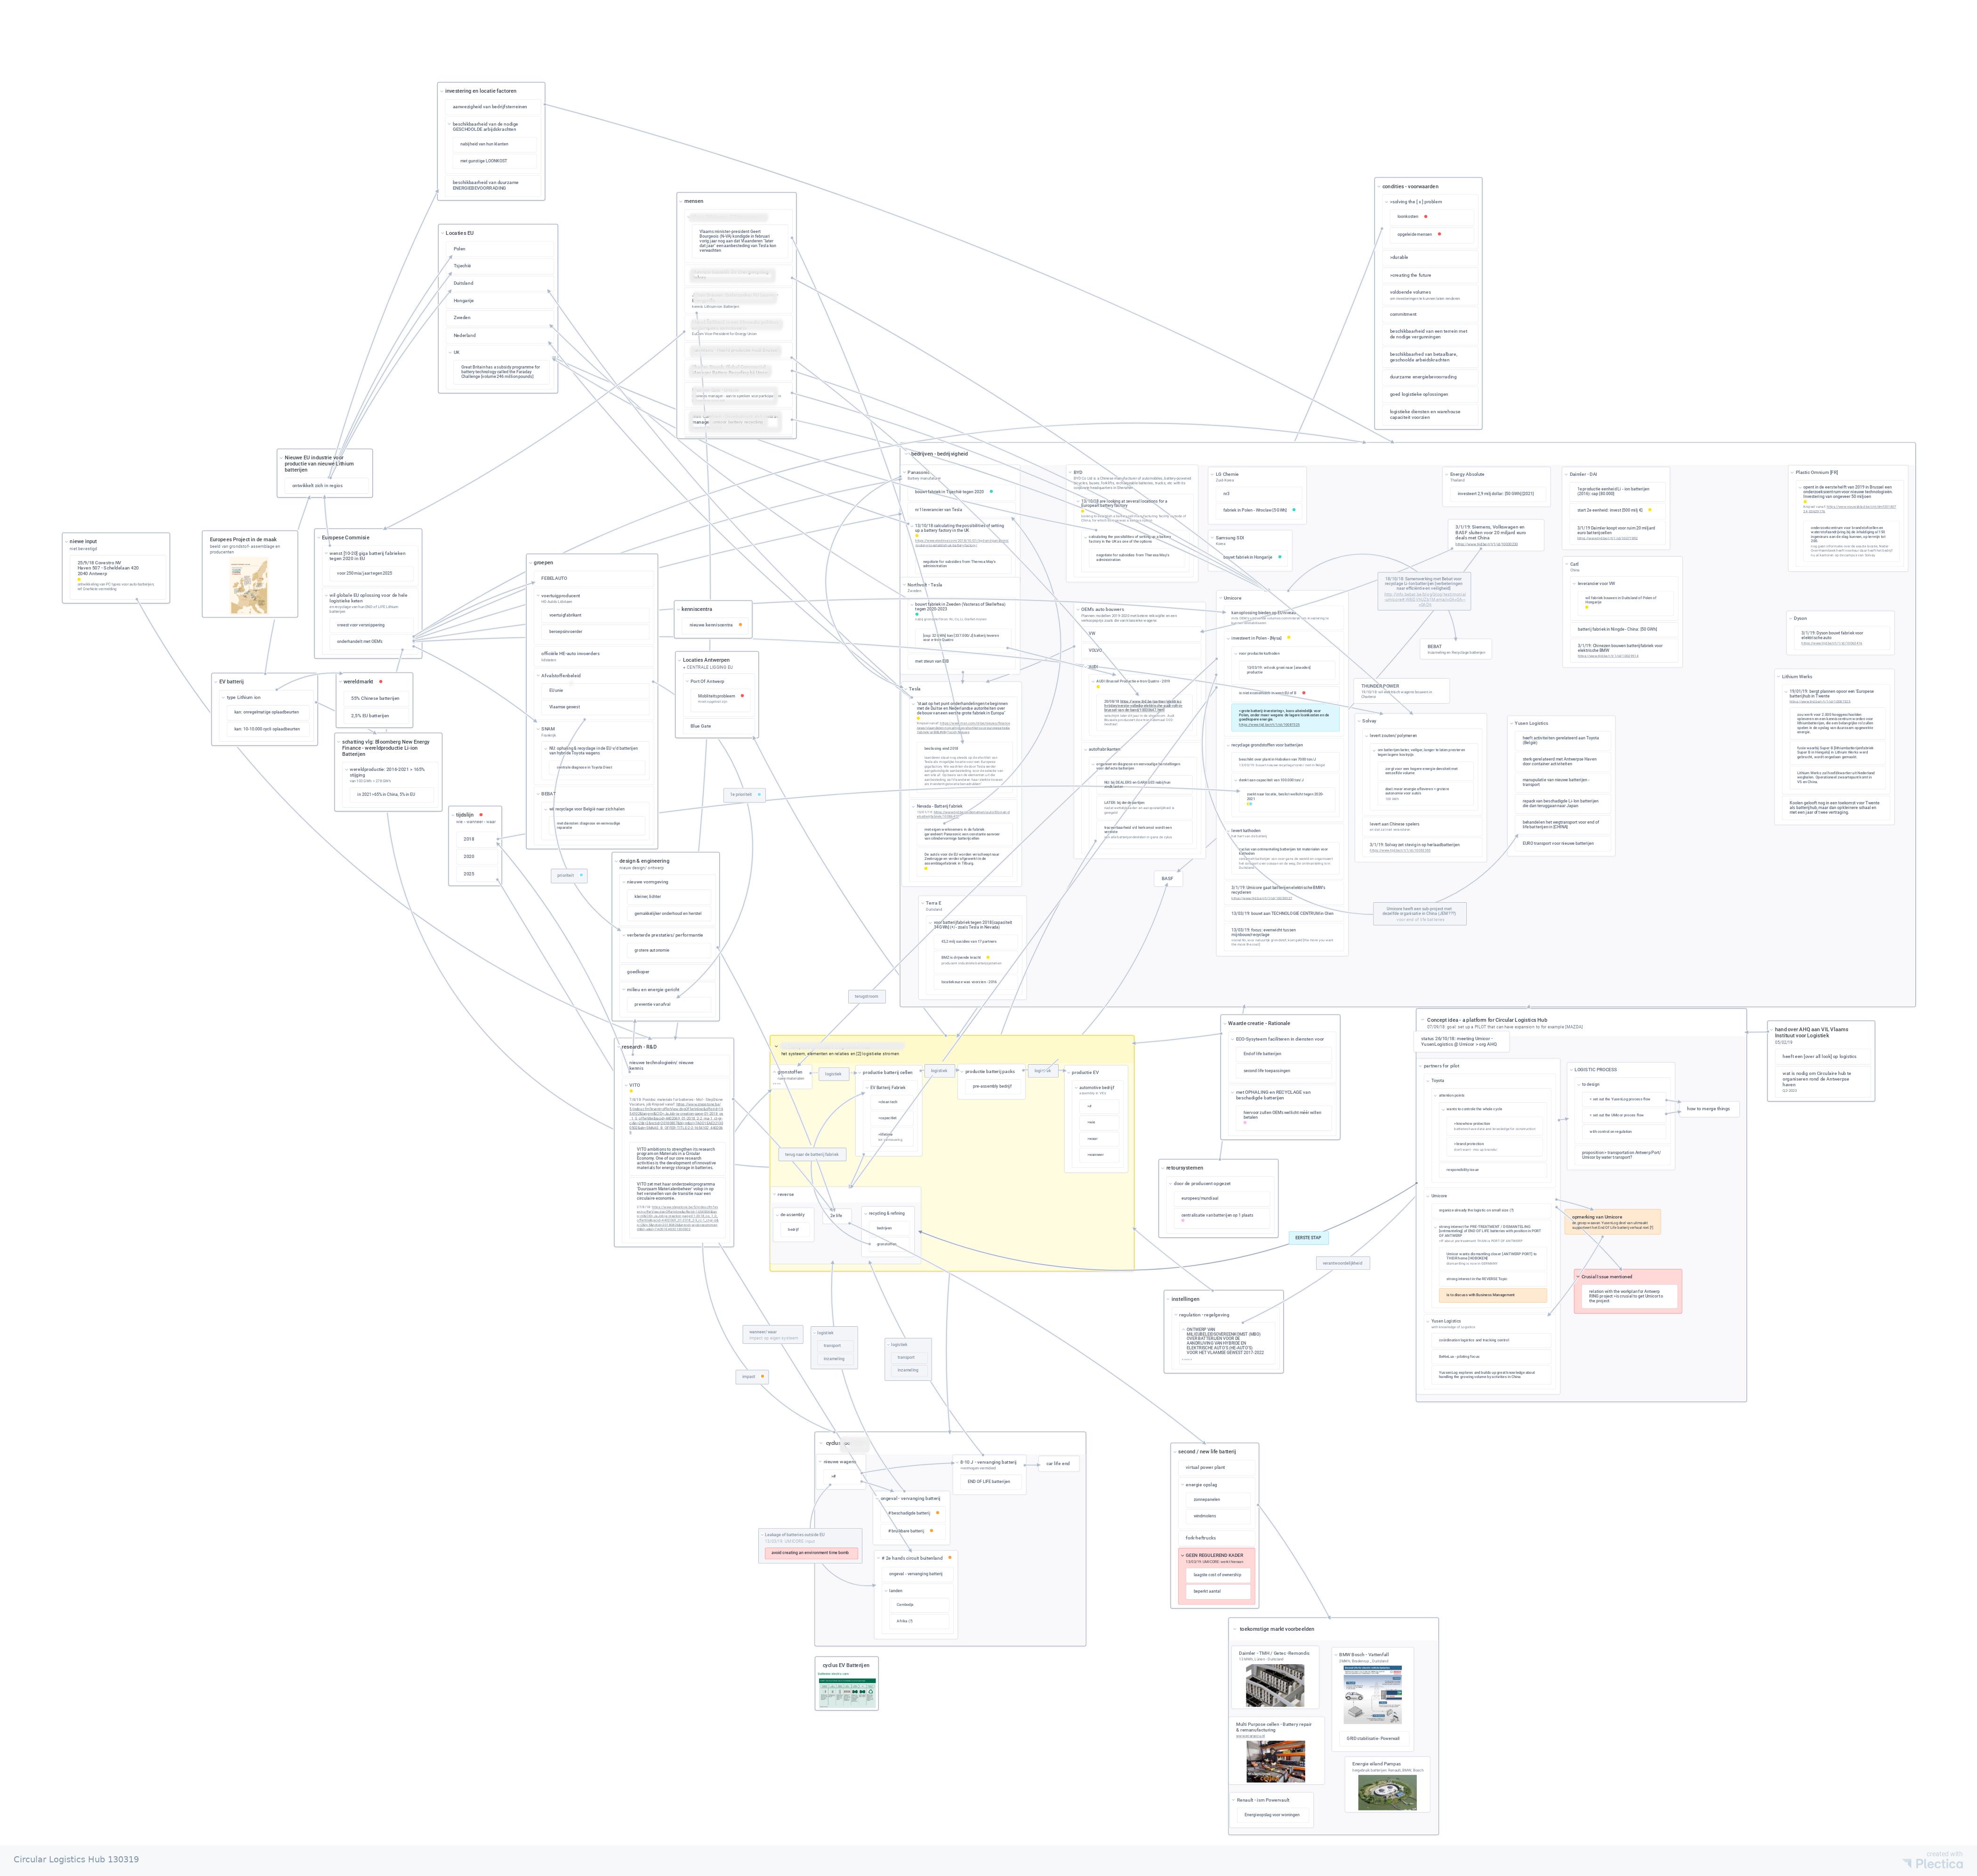
I created a map for an Investment Manager to visualize the context around a theme . The digital map links the essential information to a core theme in a well-arranged structure. With an A1 print–out on the table you get the whole context explained in a few minutes to people whom you invite in a collaboration on the theme. Discussions with potentially involved groups give rise to new insights that further build up the map as a (systems)model. The map shows the playing field in which the theme develops. You can easily submit the digital map for evaluation of the theme proposal to get feedback from people with different perspectives.
To help you create your maps and for training your mapping skills, please feel free to contact me:

